
Sometimes you don’t see change because you aren’t looking at the right time scales. But in the think-tank world, we have the luxury to take a long, holistic view of trends affecting the military services across a wide range of issues and capabilities, which the drumbeat of life in the Pentagon generally does not allow. Over the course of several projects, we have noticed significant trends culminating in a sea change in service—particularly Navy—manning.
Great power competition, emerging domains such as space and cyber, and new technologies such as large-scale computing and artificial intelligence are changing the shape and role of military manpower. While volumes may be written about this, what follows are three “postcards”—self-contained statements that combine disparate data sources to offer simple insights. These are not fully fleshed out analyses, but rather short bits intended to raise awareness, start a conversation about what is happening in manpower, and begin to anticipate the consequences.
#1 Manning Per ‘Unit’
The first postcard is about the mix of manpower and the fundamental units of military force. The way the services are equipped has changed dramatically over the past 50 years, and we should expect the way the services are manned to change in response. This postcard focuses on the Navy; it is ideal for this type of study because a fundamental measure of a navy is the ship, which is fixed, intuitive, and reported consistently and in detail. Combining data from the Naval History and Heritage Command and Defense Manpower Data Center, we produced Figure 1A.1
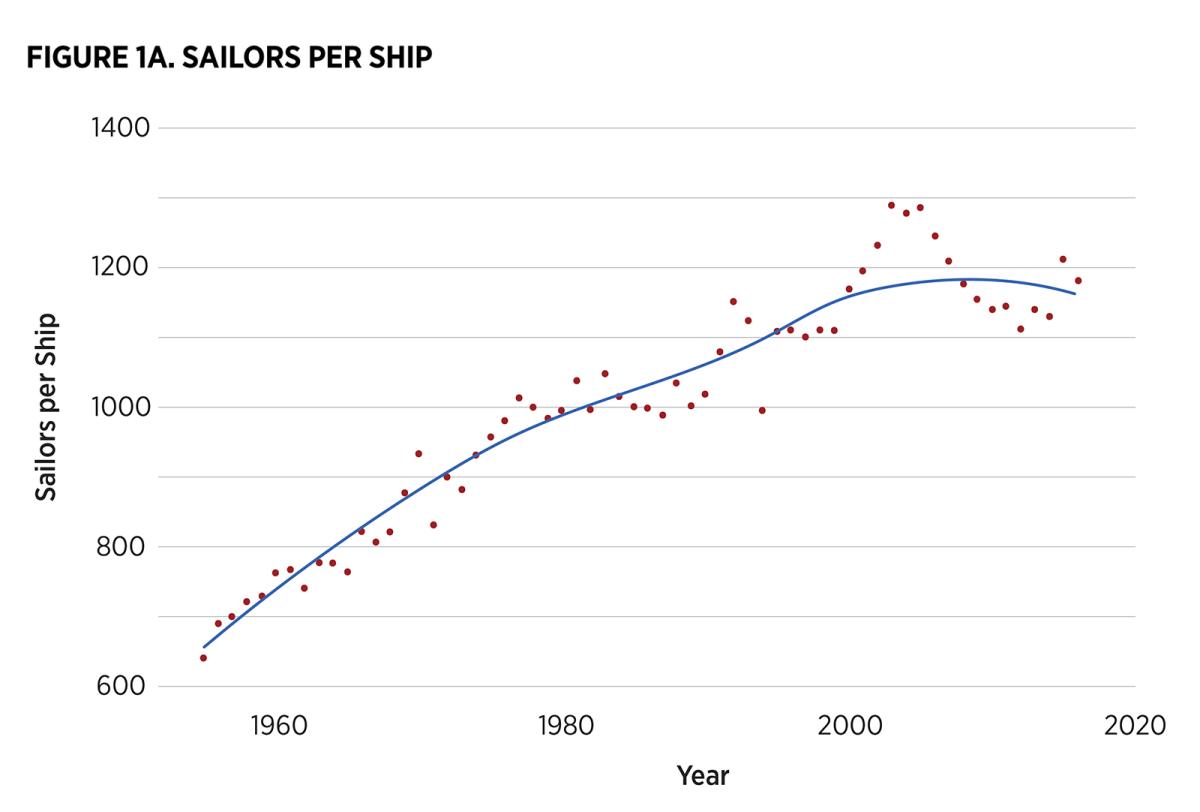
The number of sailors per ship, defined as the total end-strength of the Navy divided by the number of ships in the fleet (including auxiliaries), has been growing steadily over time, from a minimum of 641 per ship in 1958, peaking at 1,288 in 2003, and varying around 1,200 per ship since 2000.
While not explicitly studied, personnel tempo as measured by the deployment cycle of individual sailors across the force has not had a commensurate decrease. Of course, the Navy engages in many activities that do not involve ships. For example, the maritime patrol community owns and operates airplanes that support ships, not ships themselves. This postcard points to a future where the Navy is increasingly reliant on operationally deployed activities that do not explicitly involve ships and shiphandling.
An additional measure is the amount of operations and maintenance (O&M)funding—the money that keeps the services’ equipment operating—expended per service member. Figure 1B shows an exponential growth rate, meaning the amount of materiel and funding each individual service member is responsible for is growing, as is their financial responsibility—regardless of tactical responsibility. In short, the trust we put in service members for operations and maintenance is growing.
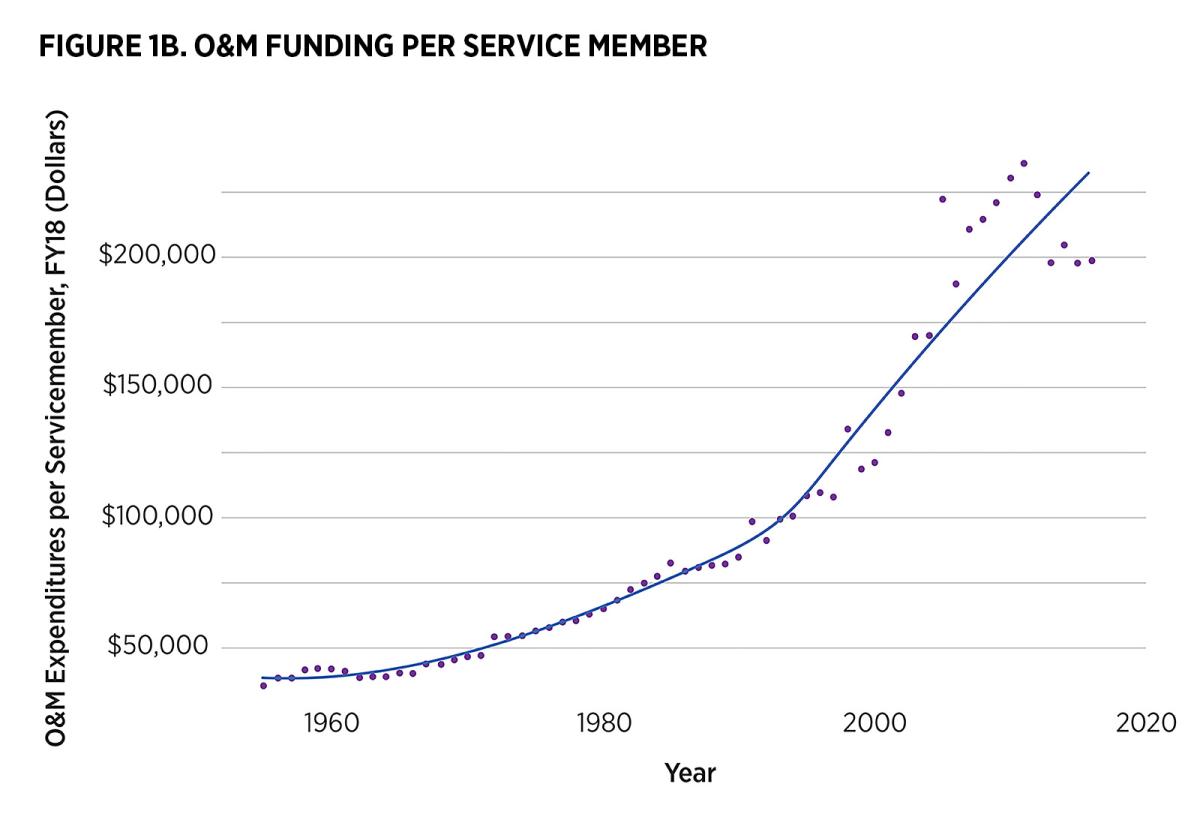
O&M funding per service member has increased faster than the rate of inflation for various reasons, including the growing costs of the defense health program, fuel, and installation maintenance.2 O&M funding also includes the growing costs of the civilian workforce.
#2 Mix of Compensation
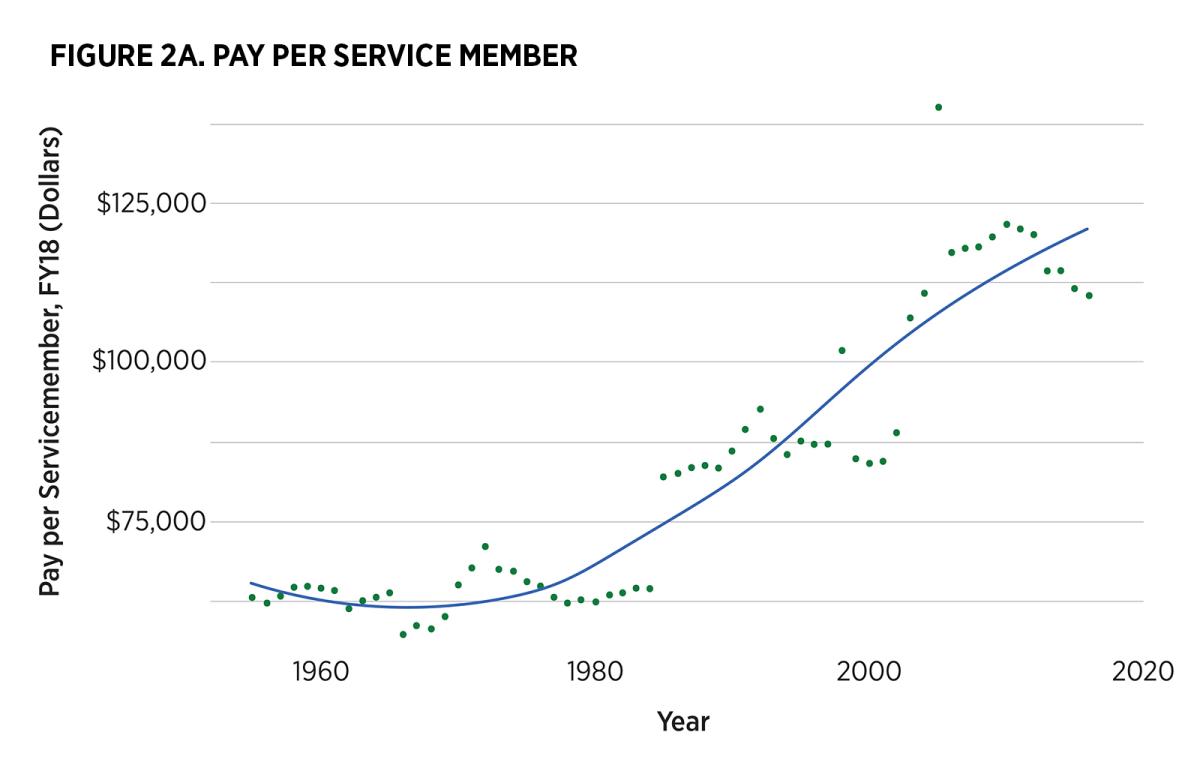
The second postcard deals with the way service members are compensated. Service member pay is complicated, as it is a mixture of pay and nonpay benefits. This graph considers only the “military pay” line of the Department of Defense (DoD) total obligation authority.3 When analyzed in real terms—constant-year, inflation-adjusted dollars—the average pay per service member has risen sharply, as shown in Figure 2A.
However, while the average pay per service member is increasing, the size of the force is shrinking, which leads to a decline in overall salary costs. See Figure 2B.
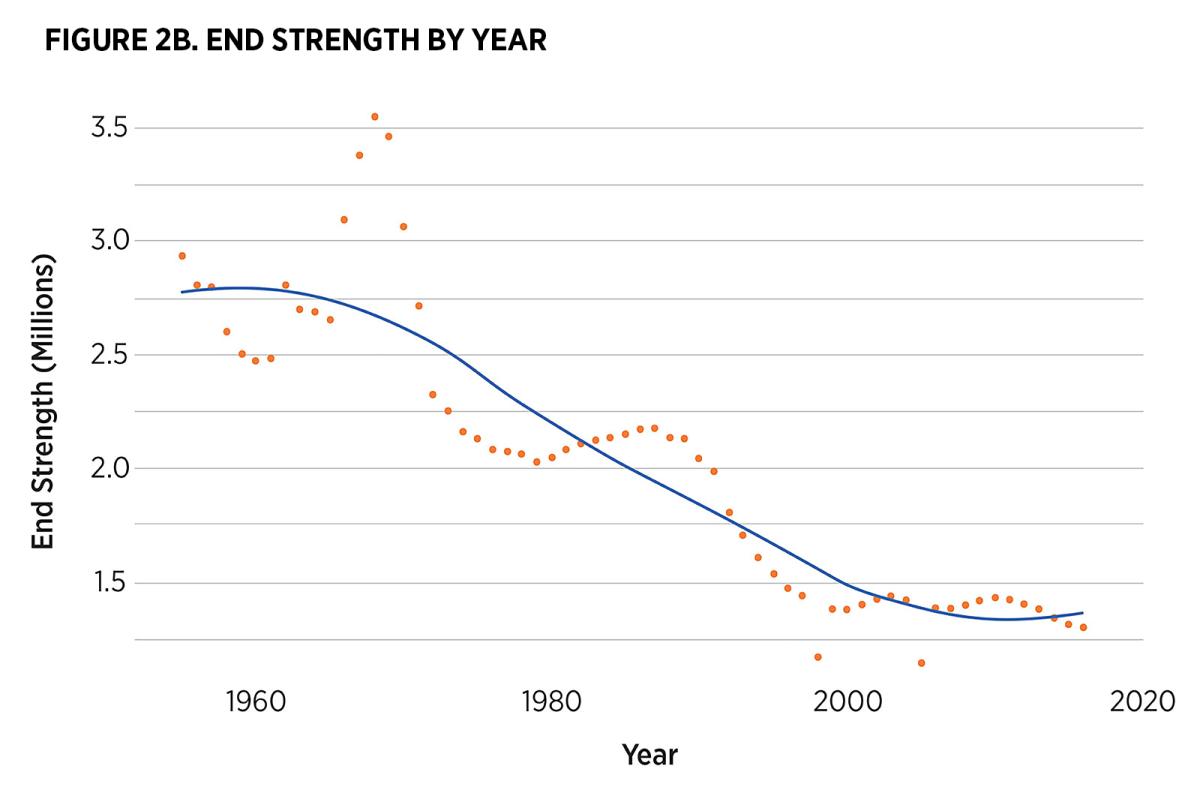
The point of this postcard is that the United States is moving toward a smaller, better-compensated force. This is to be expected as increases in automation reduce the amount of sheer manpower required while increasing the technical wherewithal each service member must have. Consider, for example, the many and various types of equipment a boatswain’s mate must be able to operate on a deployed ship.
Pay per service member has trended upward since the United States ended conscription in 1973. Fielding an all-volunteer force has required offering competitive compensation to attract talented recruits. Since the late 1990s, personnel costs tied to housing allowances, basic pay, and TRICARE for Life also have increased markedly, driving up personnel spending as a whole.4 The increases are understandable and deserved; still, they have changed the long-term fiscal responsibilities facing DoD.
#3 Military Vs. Civilian Pay
The preceding figures show a military force that increasingly is performing support functions in addition to traditional roles. But support functions are not provided strictly by military members. The third postcard draws into sharp focus the changing nature of the force and its support. See Figure 3.
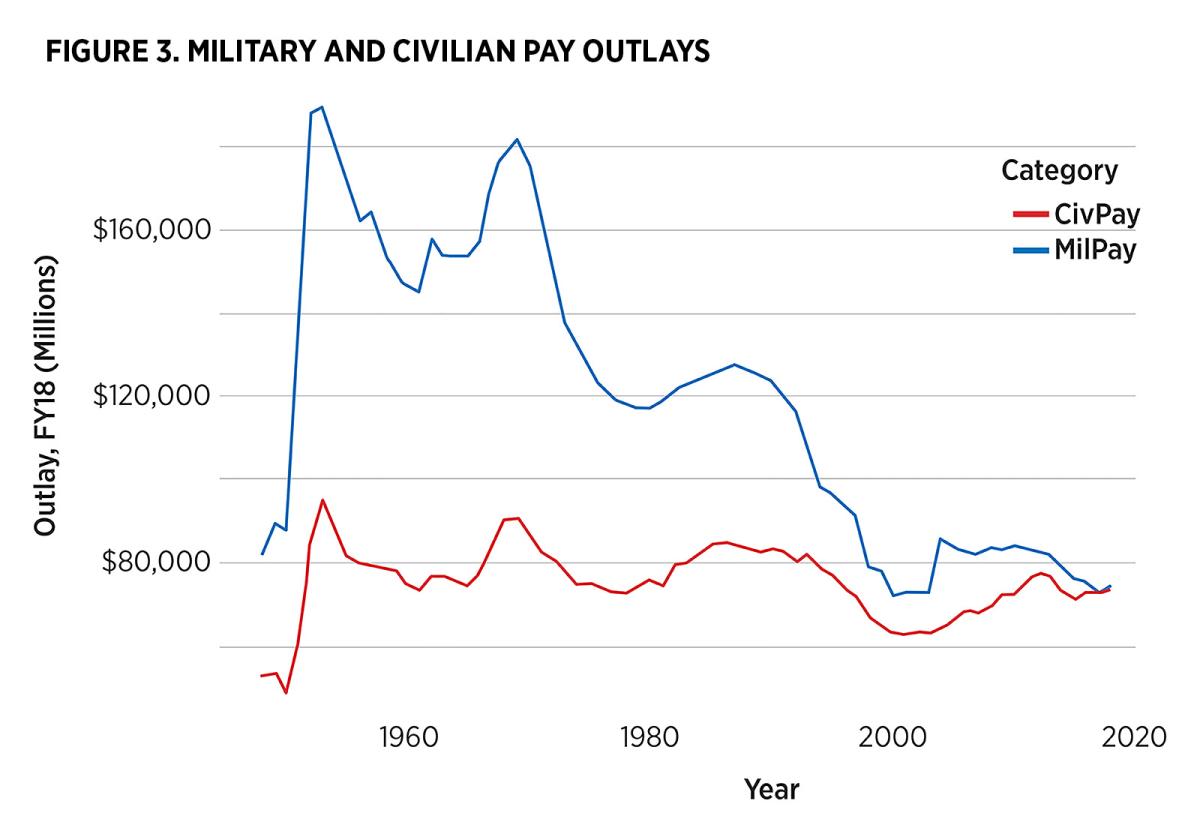
There was a tipping point in 2018 where the outlays for uniformed and nonuniformed contributors to DoD (as measured by pay) became equal. The convergence of military and civilian pay outlays has several overlapping causes, including the trend of civilian workers retiring later in life and the choice by many federal employees to postpone retirement following the 2008 economic crash.5
Synthesis
These postcards show a story that many already have known; that is, the shape of the force is changing, and the number of service members required to support an equal number of “front end” forces is increasing, at least for one service and by one measure. They also show how the complex relationship between service members, quantities of equipment, and the costs of operating that equipment have changed over time.
In total, the force is getting smaller, better compensated, and with greater responsibility.
1. Naval History and Heritage Command (NHHC), “U.S. Ship Force Levels: 1886-present” (2019), and Defense Manpower Data Center (DMDC), “Military Personnel” Web Resource” (2019), www.dmdc.osd.mil/appj/dwp/dwp_reports.jsp. For this and subsequent plots, the blue trendlines are generated by locally estimated scatterplot smoothing (LOESS).
2. Congressional Budget Office, Growth in DoD’s Budget from 2000 to 2014 (November 2014), 5–6.
3. Office of the Under Secretary of Defense (Comptroller), National Defense Budget Estimates for FY2020 (May 2019), Table 6.2.
4. Congressional Budget Office, Growth in DoD’s Budget from 2000 to 2014, 2–3.
5. Office of Personnel Management, Retirement Age & Trend Analysis of the Executive Branch: Fiscal Year 2015 to Fiscal Year 2017 (September 2018), 5–7.