In 1964 NASA sponsored an “Oceanography From Space” symposium at the Woods Hole Oceanographic Institution. Scientists exchanged ideas about the possibilities of an entirely new way of conducting ocean research. Next, NASA provided funding to the Office of Naval Research (ONR) to assess how the new techniques could improve oceanographic studies. Several academic institutions were awarded ONR money to begin work with the space agency by using its research-aircraft platforms.
The real advantage of remote sensing was to be able to put the oceans at arm’s length to observe large-scale phenomena. Also, researchers could now ‘freeze-frame’ critical ocean-atmosphere interactions that occur within a time span of minutes or less. This was something that no research ship, or even a synchronized fleet, could do. Research ships typically travel along a track line. At certain places they stop to make “stations” where a variety of measurements are taken. At best, the stations are hours apart. Then the data along the track are analyzed, plotted, and blended as if all stations had been done at the moment in time. Understandably, this time distortion resulted in a lot of information being lost due to the averaging of all stations’ data. Earth-orbiting platforms did not do this and their data were real-time.
Initial aircraft support was provided by NASA’s Houston (now Johnson) Space Center. Two aircraft were fitted with a suite of passive remote sensors. For several years these planes were the mainstay of the early efforts that helped define “oceanography at arm’s length.” In addition, the early Apollo spacecraft missions were tasked to make high-resolution photographs of sea-surface phenomena as suggested by the remote-sensing researchers.
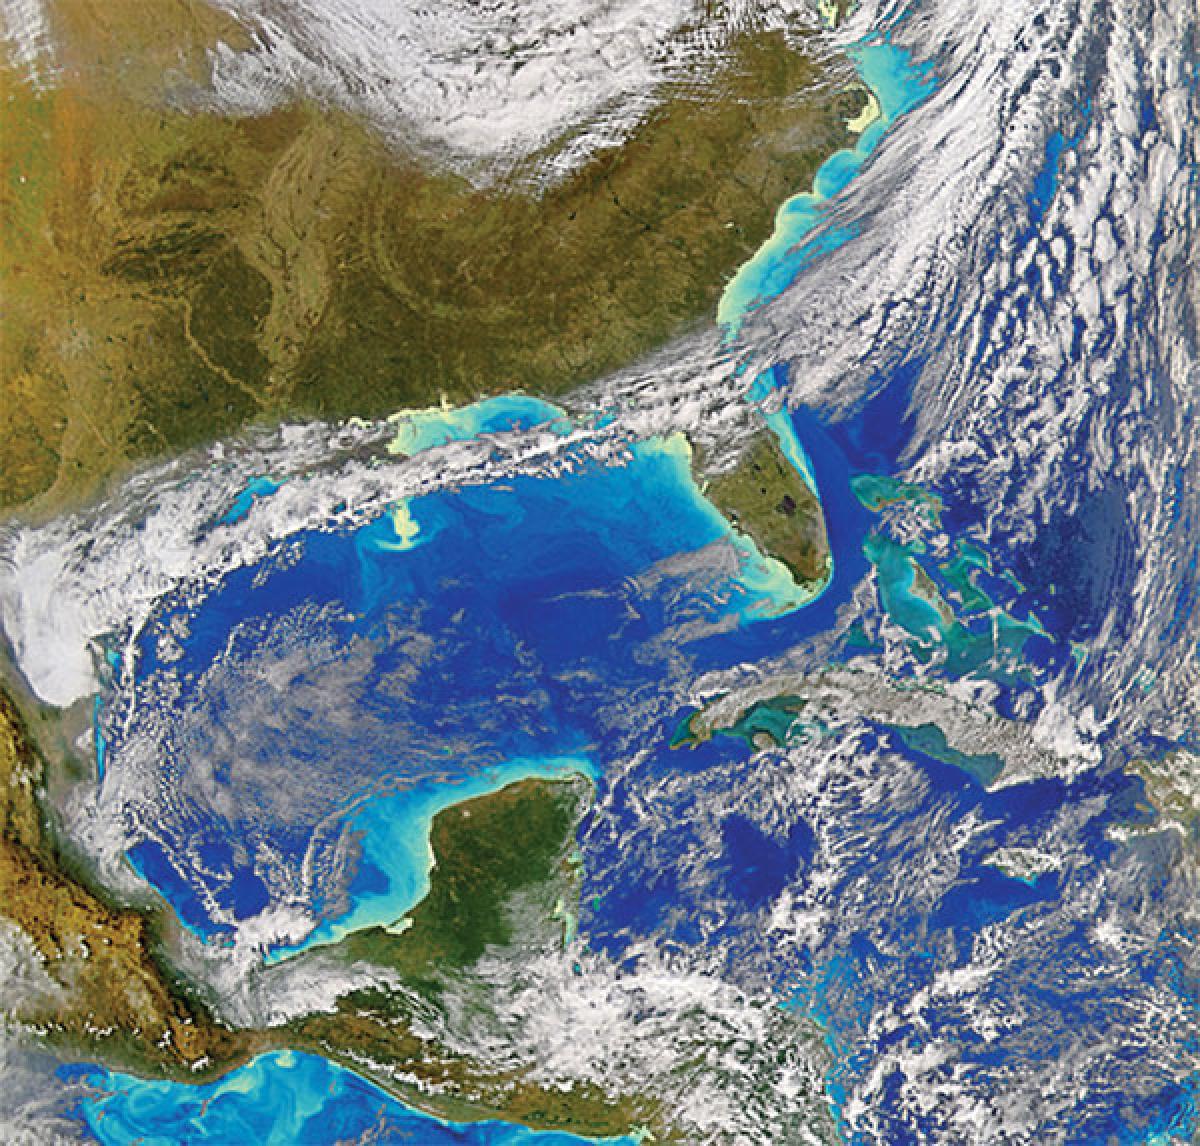
The early experimental flights demonstrated that many features could be seen remotely even though the sensors only saw the oceans’ surface “skin.” Visual imagery meant much more than pretty pictures—it showed that many internal processes in the ocean could be observed by their surface expressions. Now, large-scale ocean phenomena could be seen in a single image, something that no ship could do. For example, with the proper sun angles you could see internal waves and surface wind fields. Even oil slicks from spills could be detected.
Two broad families of sensors were developed and rapidly improved. Passive sensors viewed the sea for phenomena such as surface temperature, salinity, and color. For example, color sensors could detect the green chlorophyll pigment found in microscopic phytoplankton, the “grass of the sea.” This capability has become a powerful tool for estimating oceanic bioproductivity.
Active sensors radiate energy to measure ocean heights, surface currents, and wind fields. In addition, airborne lasers are now used to map the seafloor in relatively shallow coastal waters.
In the early years most oceanographers were not very enthusiastic about doing research from aircraft or spacecraft. The reluctance was mostly because it was a new and unknown methodology for seagoing scientists.
Also, an early off-putting factor was realization that data from just one satellite orbit could overwhelm the investigator accustomed to working in the slower data-rate environment of a research vessel. Thus, in addition to learning what could be done from remote platforms, a new means of processing massive data outputs had to be developed.
Convincing oceanographers to try these new techniques required time and marketing skills to demonstrate that a new family of tools was now available to them. It is no longer a problem today; volumes of books and reports describe the what, how, and where of oceanic remote-sensing. From the 1970s onward dozens of specialized spacecraft have flown in support of World Ocean research programs. The big picture continues to get bigger.
To learn more about NASA’s Earth Observation Program and to see some really great imagery, go to: http://earthobservatory.nasa.gov/.