The greatest limiting factor for a modern warship is fuel. Potable water produced on board, food, and communications all require electricity from a ship’s service gas-turbine generators (GTGs). Ship propulsion requires diesel-fueled gas-turbine main engines (GTMs). Diesel fuel marine (DFM), also known as F-76, is the power that keeps a warship at sea and fully operational.
Generally, fuel efficiency considerations take a back seat to operational imperatives—if the mission calls for a 25-knot speed of advance (SOA), then the ship must burn the fuel to achieve that speed. Consider a guided-missile destroyer, for example, transiting into port or conducting an underway replenishment. All three GTGs and four GTMs will be running for maximum plant reliability (Max Plant), even if only one GTG is ordinarily required to power the entire ship.
However, there are times when fuel economy can be integrated into operational priorities, either because of the nature of the tasking or to maximize endurance. This fact should have all surface warfare officers continually asking, “What is the most fuel-efficient way to drive a ship?”
Standard Fuel Efficiency Calculation
There are several ways to configure the ship’s engineering plant. Trail Shaft has only one GTM online, powering one shaft while the other spins freely, limiting that destroyer to 23 knots. At Split Plant, one GTM on each of the two shafts is online, limiting speed to 27 knots. And at Full Power, all GTMs are online, allowing speeds greater than 30 knots.
Each GTG burns 200 gallons per hour (GPH) regardless of plant configuration or speed, varying only slightly with the electric load. There is a diminishing return in maximum speed from doubling the number of engines online because the power needed to overcome a given drag force is proportional to the cube of speed.1 Traditionally, two charts are presented for calculating the ship’s optimum operating conditions: one showing GPH versus speed and, the other, gallons per nautical mile (GPNM) versus speed.
For conditions in which the ship is held on station, such as at night, awaiting entry to port the next day, the slowest speed possible is the most efficient. If the seas are calm enough and the area free of traffic, the ship may even drift with all GTMs offline or running only one on idle. If headway is required for safety or comfort, then 3–7 knots will be ordered, consuming the fewest GPH possible.
For ocean transits, DFM use is typically measured with GPNM by the equation: GPNM equals GPH divided by knots (nautical miles per hour). As such, the relationship between GPNM and speed is parabolic; while GPH may increase at a higher speed, the number of hours spent traveling a given distance decreases inversely. The most efficient speed for each plant configuration is 13–14 knots at Trail Shaft, 15 knots at Split Plant, and 17 knots at Full Power. For transits in which time is not critical, an SOA of 13–14 knots at Trail Shaft is used because it gives the best fuel economy.
Exceptions to the Standard
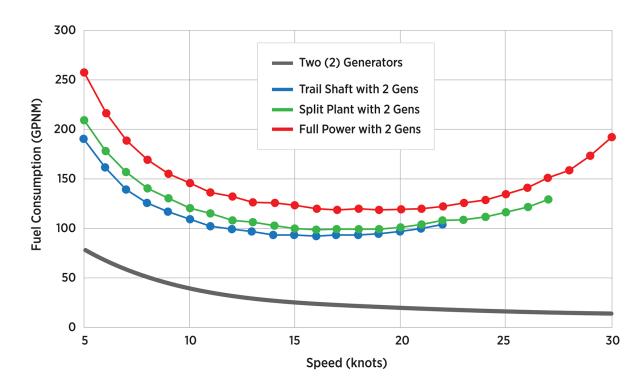
The standard process is not always the best process to achieve maximum fuel efficiency, however. While one GTG can provide enough power for the ship under normal conditions, two GTGs are usually run for redundancy. Since the GPH are constant, GPNM decreases with speed. Thus, GTMs have a square relationship and GTGs an inverse one to speed. With the two combined for total fuel consumption, the most efficient speeds are not necessarily 13–14, 15, and 17 knots for Trail Shaft, Split Plant, and Full Power, respectively. Figure 1 shows the total fuel consumption curves with two GTGs online.
With two GTGs, the optimum speed increases to 16–17 knots at Trail Shaft, 17–18 knots at Split Plant, and 17 or 19 knots at Full Power. This is significant. For a transit of 2,175 nautical miles (nm) from San Diego, California, to Pearl Harbor, Hawaii, traveling at 17 knots versus the GTM-only optimum speed of 14 knots saves 27 hours from a 155-hour trip (17.6 percent). The fuel savings end up being little more than approximately 0.2 percent, but the time saved means less food is consumed, fewer gas-turbine run-time hours (wear and tear), and potentially more liberty for the crew.
Total fuel consumption analysis does have some limits. Its underlying assumption is that the engineering plant is offline (in a cold-iron status) at the beginning or the end (or both) of a transit and that the ship is drawing entirely from shore power. Of course, this is not always the case, especially in overseas ports. If the ship has to continue operating GTGs while at anchor or in a foreign port, more days pierside means more fuel burned, reducing or eliminating the savings from setting SOA using total fuel consumption analysis.
For this analysis to provide the time and marginal fuel savings demonstrated in the San Diego to Hawaii example, the ship’s navigator and operations officer need to be fairly certain the ship not only will get shore power on arrival, but also will not be made to wait long before being allowed into port. The ship must arrive very close to the time it is scheduled to go pierside. Even when accounting for a short period of time before entering port to slow down and do systems checks before moving into restricted waters, a total fuel consumption analysis–calculated speed of advance can still save time and fuel.
For example, in December 2018 the USS William P. Lawrence (DDG-110) was operating off California before returning to her homeport of Pearl Harbor. Exercises lasted until 19 December, and holiday leave was set to start Christmas Eve. To allow the crew to make flights and spend time with families, using total fuel consumption analysis the SOA for the transit was set for 20 knots. With the transit ending with the plant being in cold iron in the ship’s homeport, 20 knots would be as efficient as 14 knots. Operational considerations—completing the training mission off California and getting the crew home on time—did not need to compete with fuel efficiency.
In another example, a ship confined to a geographic area on escort duty tether with a 2,175 nm transit back to homeport could, using the previous calculation of saving 27 hours with a higher SOA, remain on station an extra day before another ship has to relieve it—while arriving in port at the same time.
Finally, during a straits transit in which Max Plant is set, the faster the ship gets through the strait, the faster it can return to a normal operating condition. GTG fuel savings are quantifiable—a speed of 17 knots versus 14 knots uses 4.86 percent less fuel from the generators alone, with 23 knots using the same amount of fuel as 14 knots.
Fuel efficiency is almost always one of several factors in a ship’s operational decision-making calculus. But in using total fuel consumption analysis, the Navy can enhance ship readiness by maximizing endurance at sea.
1. The drag force (FD) resisting forward motion is proportional to the square of velocity, as the drag equation shows: FD = ½ ρ v 2CD A, where water density (ρ) and cross-sectional area of the ship (A) are essentially constant, while the drag coefficient (CD) increases with speed. The power required to overcome the drag, PD, is governed by the equation
PD = (FD)v , creating the cubic relationship.
2. It is worth noting that Split Plant can be more efficient than Trail Shaft. If 19 knots is ordered, but the ship only makes 17 at Trail Shaft and 18 at Split Plant because of environmental conditions and no drag from a trailing shaft, then Split Plant and Trail Shaft become equally efficient.


